Monday, 22 February 2016

Building a basic stock trading system with Drools (I)

Introduction

In my previous post, I explained how can we calculate a number of indicators based on Stock prices and that, the value on those indicators is better exploited in algorithms rather that just plotted in charts. What kind of algorithm might that be?

I mentioned that one possibility is that each indicator has a "voice" or "opinion" and that the output of the algorithm is the sum of all those opinions, some sort of consensus. Then we can translate that consensus in actual actions: Buy and Sell orders.

How can we model those opinions? Basically, they are rules responding to certain mathematical expressions. One option to evaluate is a Java-based rule engine: Drools.

But first, take a look at the result of our calculations, so you can understand better. This graph shows a "score" given by our system on how bullish or bearish (that is, whether it has an upward/downward chance) a stock is. This score is calculated using simple indicators (Simple Moving Average, New MAX, New Min, etc.)
The price and indicators above, the SCORE indicator below

In this case, the rules said:

  • + 1 when the price is over the SMA(200).
  • + 1 when the price is making new MAX taking into account the last 200 days.
  • -1 when the price is under the SMA(200).
  • - 1 when the price is making new MIN taking into account the last 200 days.

So we can extrapolate that:

  • If the score was negative, and it has become positive; it´s likely for the price to go up.
  • If the score was +1 and becomes +2, it gets even better.
On the other hand:

  • If the score becomes negative or makes new lows, it´s time to close our position and avoid more losses (see right part of the graph).

Note: Please keep in mind that the main purpose here is learning the technology and have fun, don´t expect Warren-Buffet-like returns!

Sunday, 14 February 2016

Calculating and showing stock indicators with Spark & AngularJS

Summary

In a previous post, I showed how simple is to calculate a SMA (Simple Moving Average) indicator from your list of stock quotations. Today, let´s see how can we modify the code to calculate multiple indicators at once (for the moment, I could not implement it using several different sliding windows at once).

Also, let´s introduce a quick prototype coded in AngularJS in order to show the different indicators in a chart with the possibility of switching stocks and windows sizes live. This is just a debug feature as our aim is to use the indicators in our future home-made analysis algorithm.

Note: If you don´t know what SMAs are, you should read this before.

Live example?

This is much easier to understand if you see an actual example running, but unfortunately I'm having problems injecting an iframe here that shows the content properly. Instead, you can clone the repository and run the application with the test files included in it:
git clone https://github.com/victor-ferrer/sparkker
Note: The application requires a Java 8 JRE installed in your machine. Also, the JAR file is rather heavy as Spring Boot adds an embedded Tomcat Server and all the Spark dependencies...

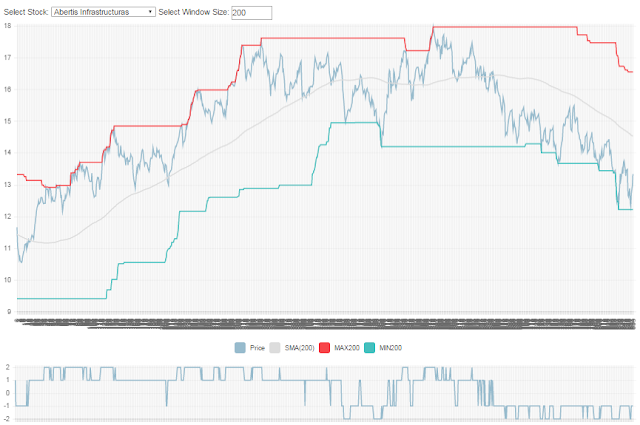
Here is a screenshot of the application that will be accessible at http://localhost:8988/#/indicators

Chart showing the upward trend followed by one stock.
The different lines are the indicators calculated on a 200 days window.

Thursday, 4 February 2016

Video: Lambda architecture with Spring XD and Spark

Summary


Today I do not have any piece of code worth showing you. Instead, I would like to quickly comment on this YouTube video, which I have seen recently, that is coming from one the SpringOne2GX 2015 event (and later released to the public).


Note: The fact the these talks are published more and more often (like what happens with the DockerCon talks) kinda puts me off from paying the high premium involved in physically assisting to these events...

Sunday, 31 January 2016

Calculating Moving Averages with Spark MLLib

Update on Friday. 13rd of January, 2017

This post is about the implementation using the Java API. If you want to see the same example of calculating Moving Averages with Spark MLLib but using Scala, please check out this post.

Introduction

Since I began learning Spark, one of the things that given me the most pain is the Java API that wraps the Scala API used in Spark. So, I would like to share this problem I had using the Spark Machine Learning library in case is useful for anybody learning Spark. Also, it´s nice to take a look to the possibilities that the sliding windows give us when working on timed data.

The problem

As I wrote in my previous post, I created a new independent module to make studies on Stock data using Spark. One of the most interesting (and basic) studies one can make over Stock data, is to calculate the simple moving averages.

What is a simple moving average (SMA)?

If we take a window of time of length N, the SMA is:
Source Wikipedia: https://en.wikipedia.org/wiki/Moving_average
Wait, what? In plain English: For every element, we take the N precedent elements and calculate the average. The aim is to smooth the data in order to easily detect underlying patterns in the data.

One possible solution: Spark MLLib

Searching around in internet, I found that the Spark Machine Learning Libray has a sliding window operation over an RDD. Using this, it would be very easy to calculate the SMA as described in this StackOverflow answer.


Note: The RDD must be sorted before appliying the sliding function!

The caveat is that the previous code is written in Scala. How would it look like in Java?

Saturday, 30 January 2016

Orchestrating your microservices with Eureka and Feign


Introduction


This is a well known scenario: It´s time to add some new functionality to your application and you decide to add a new member to the family of micro-services.
In this example, we are going to use a service called "Sparkker" that will consume stock quotations from anothed service called "Stokker" and will publish the results to another service called "Portfolio-Manager"

This is a diagram showing the whole picture:


It´s obvious that the number of lines connecting the services increase and increase, making the maintenance and configuration of the system very tedious. How can we solve it? We can´t spend the whole day coding integration code, we need to deliver added value!

One possible solution to all this mess is to use some of the components from the Netflix Stack that have been incorporated to the Spring Cloud project and that are very simple to use within Spring Boot. Interested?

Thursday, 19 November 2015

Dockercon 2015

Just returned from the DockerCon 15 that took place in Barcelona, Spain. It has been a somewhat tiring but interesting experience. Here there are some quick thoughts I´d like to share with you.

Brand new Docker functionalities


In the general session, at the very beginning of the conference, some new features were show-cased and seemed  very interesting:
  • Production-ready Docker Swarm (which handles the creation and orchestration of a large number of containers in distributed applications).
  • Out of the box multi-host networking.
These two features were demonstrated by creating 50.000 containers on 1.000 Amazon Web Services nodes. However, I would have loved to see them actually performing some work, (rather just starting up). Specially hard would have been to share some workload and perform some kind of coordination...

Here you can see the video from the general session:


The demo done on the Docker Toolbox was quite interesting, it might be a really good tool in order to ramp up new developers coming to your project.

Tuesday, 27 October 2015

Introduction to CI and Cloud deployment with GitHub,Travis and Heroku

Introduction


These past weeks, while (eventually) working in my Stokker project, I noted the lack of continuous build that I usually enjoy at work. I committed many bugs to my code-base and even, non-compiling code!

So, what are the alternatives to fix this situation? Perhaps having a local Jenkins environment? Too hard to maintain. No CI at all? Not feasible if we pretend that somebody might cooperate in the future.

One possible solution: Use Github integration with Travis CI and Heroku


This is one of many and, to be fair, I did´t do a thorough study on the different choices before trying it. I noticed that JHipster is using it as CI system for part of its code-base, though.

Basically, what Travis-CI does is to poll regularly your repository and perform a build based on the parameters specified in a file called .travis.yml.

Here, we can see a very basic example on how does this file look like:
Basically, we are stating that:
  • This is a Java project. As no build.gradle file has been provided, it will execute these Maven commands:
    • mvn clean install
    • mvn test
  • We intend to deploy the result of the successful build to Heroku
    • You can get the API Key later on, after registering in Heroku.

Hint on working with the .travis.yml file: One handy tool is this YAML validator, specially due to the cryptic error messages given by Travis-CI.

Once a change in the master branch is detected, Travis-CI will pull the code and perform a Maven build. If a compilation or test failure is detected the process will be stopped and notification mails will be sent.

This is how a successful build looks like:


As said, once you have a successful build, Travis CI will trigger a Heroku deployment. By the way, what is Heroku? Heroku is a commercial PaaS that also offers some free functionality for hobby programmers and people learning. If you want to test it, follow this steps:

  • Register in Heroku with your personal details.
  • Create an application and link it with your Github:
    • By doing so, you will be provided with an application key (which was inserted in the YML snippet above).
  • Choose the "Free" dyno mode. This mode offers you very limited resources and the machine is shut down after 60 minutes of inactivity.
    • By the way, these are the different plans available:


The way in which your application is executed, is defined in a Procfile (this file should be placed in the same folder of .travis.yml)


Running example


You can check the unfinished application running here: https://stokker.herokuapp.com

Update on November 1st 2015: I had to separate Stokker and Portfolio Manager into two different Github repositories (and two Heroku applications) in order to be able to run both of them so the URL for the Portfolio manager in Heroku is now: https://stokker-portfolio-manager.herokuapp.com

  • Please excuse me for the ugly interface, learning AngularJS is still one of my non achieved goals!). Moreover I have not yet provided a CRUD JavaScript interface for the entities managed in the project (Portfolio, Market Position and Stock). If you want to interact with the database, you can use the Spring Data REST endpoints:
  • You will notice that no price is used for the portfolios, as I still have not figured out how to run more that one application per repository.
  • Kibana functionality won´t be available.


Manage your application with Heroku toolbelt

Heroku offers you a tool called Heroku toolbelt that you can install in your local computer and use it to:
  • Manage and monitor your applications:
    • You can login and check the application logs.
    • You can deploy directly by performing a git push heroku.
  • Deploy your applications in a local environment in order to ensure that everything is OK before pushing your code.

Resources

This is a really shallow introduction to Travis CI and Heroke. I am astonished, as the more I read the more documentation I found. Here you might find some interesting links in case you want to continue learning on this topic:


Hope that you find this quick introduction interesting, any feedback is always more than welcome! You can find the code of the unfinished application here.