In my previous post, I explained how can we calculate a number of indicators based on Stock prices and that, the value on those indicators is better exploited in algorithms rather that just plotted in charts. What kind of algorithm might that be?
I mentioned that one possibility is that each indicator has a "voice" or "opinion" and that the output of the algorithm is the sum of all those opinions, some sort of consensus. Then we can translate that consensus in actual actions: Buy and Sell orders.
How can we model those opinions? Basically, they are rules responding to certain mathematical expressions. One option to evaluate is a Java-based rule engine: Drools.
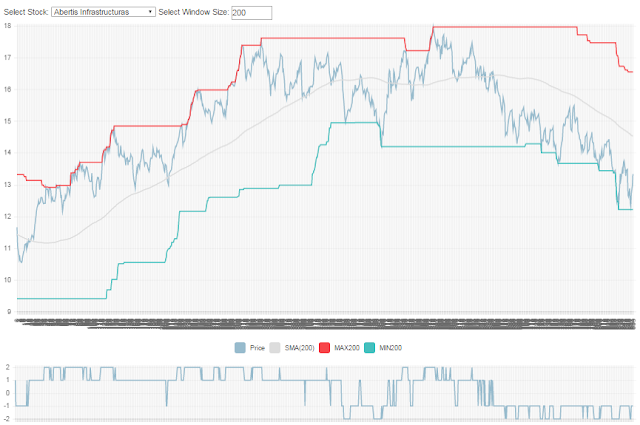
But first, take a look at the result of our calculations, so you can understand better. This graph shows a "score" given by our system on how bullish or bearish (that is, whether it has an upward/downward chance) a stock is. This score is calculated using simple indicators (Simple Moving Average, New MAX, New Min, etc.)
 |
| The price and indicators above, the SCORE indicator below |
- + 1 when the price is over the SMA(200).
- + 1 when the price is making new MAX taking into account the last 200 days.
- -1 when the price is under the SMA(200).
- - 1 when the price is making new MIN taking into account the last 200 days.
So we can extrapolate that:
- If the score was negative, and it has become positive; it´s likely for the price to go up.
- If the score was +1 and becomes +2, it gets even better.
- If the score becomes negative or makes new lows, it´s time to close our position and avoid more losses (see right part of the graph).
Note: Please keep in mind that the main purpose here is learning the technology and have fun, don´t expect Warren-Buffet-like returns!
